Model Description
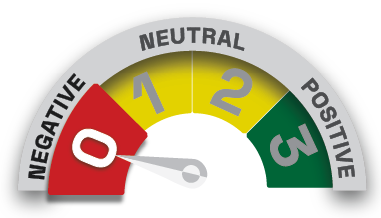
The Harmony Model uses a quantitative analysis-based identification of the current Market Condition: Positive, Neutral or Negative.
Pre-selected model choices are then automatically applied to each Market Condition, reflecting escalating levels of market exposure - below shows level 2.
The Market Condition is determined by the number of the timeframe indicators that are positive. The three timeframe indicators are the STARFLUX, GALACTIC SHIELD, and DELTA-V indicators. When all 3 are positive, the Market Condition is Positive, when all 3 are negative, the Market Condition is Negative, and when there is a mixture of positive and negative, the Market Condition is Neutral.
Construction
The Harmony Model will always consist of the investment tactics most appropriate for each Market Condition.
See the other individual models' pages for details on their composition and rules for movement.
WHEN HARMONY 2 IS IN A POSITIVE POSITION - FOLLOWS BUY/REPACE MODEL
None unscheduled — continuously invested.
Continuously invested through both Bull and Bear Markets. Use for that portion of portfolios intended to be constantly invested. Seeks to achieve outperformance from portfolio selection.
WHEN HARMONY 2 IS IN EITHER NEUTRAL OR NEGATIVE POSITION - FOLLOWS CALENDAR EFFECTS MODEL
About 11 round trip trades per year as directed by SPL.
NONE.
All trades are scheduled and communicated in advance.
28% of market days per year.
72% of market days per year.
Conservative in total market exposure - just 28% of market days. Requires an unrestricted account due to frequency of trades and short duration (6-8 market days is typical). The Calendar Effects model has been particularly effective in Bear Markets.
The performance returns illustrated do not represent actual client accounts and are net of the highest management fee and trading costs which is 0.80%. Returns reflect since inception, one, five and ten‐year periods, and are reflected in U.S. dollars and assume that dividends are reinvested.
The strategies employed may involve technical trading techniques such as trend analysis, relative strength, moving averages, various momentum and related strategies. Technical trading models utilize mathematical algorithms to attempt to identify when markets are likely to increase or decrease and identify appropriate entry and exit points. The primary risk of technical trading models is that historical trends and past performance cannot predict future trends and there is no assurance that the mathematical algorithms employed are designed properly, new data is accurately incorporated, or the software can accurately predict future market, industry and sector performance.