Model Description
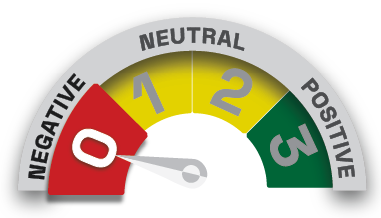
The Harmony Model uses a quantitative analysis-based identification of the current Market Condition: Positive, Neutral or Negative.
Pre-selected model choices are then automatically applied to each Market Condition, reflecting escalating levels of market exposure - below shows level 4.
The Market Condition is determined by the number of the timeframe indicators that are positive. The three timeframe indicators are the STARFLUX, GALACTIC SHIELD, and DELTA-V indicators. When all 3 are positive, the Market Condition is Positive, when all 3 are negative, the Market Condition is Negative, and when there is a mixture of positive and negative, the Market Condition is Neutral.
Construction
The Harmony 4 models portfolio construction varies by market status.
When postive, it uses the ETF SSO (Prior to the inception of SSO it used the MF ULPIX).
When neutral, it invests in the top 5 type 1 and 2 ETFs from the Equity Asset Class Ranking table on the INDICATORS and RANKINGS page.
When negative, it invests in the ETF SDS (Prior to the inception of SDS it used the MF URPIX). See the other model's pages for details on the composition and rules for movement and allocation.
WHEN HARMONY 4 IS IN A POSITIVE POSITION - USE 2X LEVERAGED S&P500 (Mt Fd ULPIX ETF SSO)
Unscheduled activity occurs when the model changes market status
When DELTA-V, GALACTIC SHIELD, & STARFLUX indicators are positive.
When at least one indicator is negative.
WHEN HARMONY 4 IS IN EITHER NEUTRAL POSITION - FOLLOWS THE BUY/REPLACE MODEL
Unscheduled activity occurs when the model changes market status
When indicator statuses are mixed.
When indicators are either all positive or all negative.
WHEN HARMONY 4 IS IN A NEGATIVE POSITION - USE -2X INVERSE LEVERAGED S&P500 (ProFunds URPIX)
Unscheduled activity occurs when the model changes market status
When DELTA-V, GALACTIC SHIELD & STARFLUX indicators are negative.
When at least one indicator is positive.
The performance returns illustrated do not represent actual client accounts and are net of the highest management fee and trading costs which is 0.80%. Returns reflect since inception, one, five and ten‐year periods, and are reflected in U.S. dollars and assume that dividends are reinvested.
The strategies employed may involve technical trading techniques such as trend analysis, relative strength, moving averages, various momentum and related strategies. Technical trading models utilize mathematical algorithms to attempt to identify when markets are likely to increase or decrease and identify appropriate entry and exit points. The primary risk of technical trading models is that historical trends and past performance cannot predict future trends and there is no assurance that the mathematical algorithms employed are designed properly, new data is accurately incorporated, or the software can accurately predict future market, industry and sector performance.