Model Description
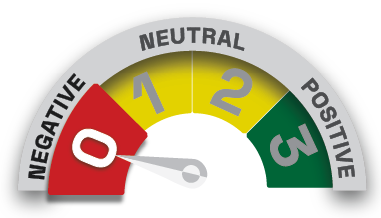
The Harmony Model uses a quantitative analysis-based identification of the current Market Condition: Positive, Neutral or Negative.
Pre-selected model choices are then automatically applied to each Market Condition, reflecting escalating levels of market exposure - below shows level 3.
The Market Condition is determined by the number of the timeframe indicators that are positive. The three timeframe indicators are the STARFLUX, GALACTIC SHIELD, and DELTA-V indicators. When all 3 are positive, the Market Condition is Positive, when all 3 are negative, the Market Condition is Negative, and when there is a mixture of positive and negative, the Market Condition is Neutral.
Construction
The Harmony Model will always consist of the investment tactics most appropriate for each Market Condition.
See the other individual models' pages for details on their composition and rules for movement.
* You can fully customize the Harmony Model by using different investments than those listed here, for each Market Condition - see the 'Model Option' buttons in the Blended Model Generator of the Portfolio Toolkit.
WHEN HARMONY 3 IS IN A POSITIVE POSITION - USE 1.5X LEVERAGED SECTOR ROTATION
US Sectors = Monthly reallocation
Bonds = Quarterly reallocation
NONE.
All activity is monthly or quarterly based on allocation.
100% in 1.5x Leveraged US Sectors when in the market.
0% in the equity market when allocated to Bond Sectors.
Model is invested 100% in either Equity and Bond Sectors, and is in one or the other at all times. When risk is high in the Equity market, the Model switches to Bond Sectors. The Leveraged ProFunds version uses 1.5x leverage when in Equities. Because this Model can be very concentrated, it is not intended for an entire client portfolio.
WHEN HARMONY 3 IS IN A NEUTRAL POSITION - FOLLOWS THE BUY/REPLACE MODEL
None. This model is continuously invested.
100% equally allocated to the top 5 type 1 and 2's from the indicators and rankings page.
This model is continuously invested through both Bull and Bear markets. Advisors should use Buy/Replace for that portion of portfolios intended to be continuously invested. The model seeks to outperformance from portfolio selection.
WHEN HARMONY 3 IS IN A NEGATIVE POSITION - FOLLOWS THE BUY/REPLACE MODEL
Change in shorter-term trend determined by STARFLUX L/S indicator.
Typical trends last weeks to months.
During periods where the STARFLUX L/S indicator is positive (green).
During periods where the STARFLUX L/S indicator is negative (red).
Rated "aggressive" due to short positions. Most suitable for regular brokerage accounts. Can be very active when STARFLUX changes status frequently. Emphasis is on up and down moves within a Bull orBear market. U.S. focus.
The performance returns illustrated do not represent actual client accounts and are net of the highest management fee and trading costs which is 0.80%. Returns reflect since inception, one, five and ten‐year periods, and are reflected in U.S. dollars and assume that dividends are reinvested.
The strategies employed may involve technical trading techniques such as trend analysis, relative strength, moving averages, various momentum and related strategies. Technical trading models utilize mathematical algorithms to attempt to identify when markets are likely to increase or decrease and identify appropriate entry and exit points. The primary risk of technical trading models is that historical trends and past performance cannot predict future trends and there is no assurance that the mathematical algorithms employed are designed properly, new data is accurately incorporated, or the software can accurately predict future market, industry and sector performance.